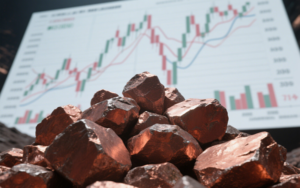

The price of gold continues to stand strong and steady above $2000 per ounce, but the gold stocks have remained stagnant, even showing a decline in the stock market despite a surge in the market.
The price difference between gold stocks and gold may confuse some investors, but this is actually a very normal phenomenon. Many investors, including gold investors, have a logical fallacy that assumes that when the price of gold rises, the price of gold stocks should also rise, and that there should be a linear positive correlation between gold stocks and gold. However, this is not the case.
Gold is a tangible asset, while gold stocks are financial assets. They belong to different financial markets and are influenced by different factors. Factors affecting the gold market include actual demand and supply, investor risk aversion, as well as global monetary policies and interest rates. In contrast, aside from being affected by these factors, gold stocks are also determined by investor sentiment, company performance, and growth prospects.
Currently, valuations and investor sentiment of gold stocks are approaching multi-year lows. In other words, the recent weakness in gold stocks over the past few quarters has been more driven by investor behavior and preferences rather than fundamental changes.
However, just this alone cannot determine that gold stocks have reached a major bottom. Another characteristic of a major bottom is a severely or extremely oversold market. Looking at three indicators, the gold miner index VanEck Gold Miners ETF (GDX), the 52-week low, and the percentage of GDX stocks trading above the 200-day moving average, this sector is undoubtedly oversold, but has not yet reached the historical extreme levels of a major bottom.
Nevertheless, it is certain that gold stocks are approaching this level of extreme oversold condition. Another indicator, the ratio of gold stocks (HUI index, also known as Amex Gold Bugs) to gold, is trending towards historical extremes. In general, if this ratio experiences a significant surge, it is usually a precursor to the formation of a major bottom for gold stocks and a significant rebound. If gold stocks enter an extreme oversold state in the coming weeks or months, the conditions for a significant rebound will be ripe.
The last condition is a significant rebound in the price of gold, such as the largest-scale rebound in gold stocks, which began at the bottoms in October 2008, January 2016, and March 2020.
Since hitting the bottom in 2008, gold rebounded by 42% over a period of 4 months, the VanEck Junior Gold Miners ETF (GDXJ) rebounded by 124% in 3 months, and by 212% over 6 months. Additionally, after experiencing a multi-month grinding bottom process in the second half of 2015, GDXJ rose by 202% over 7 months, and gold rebounded by 31%. Finally, after the sharp drop due to the COVID-19 pandemic, GDXJ surged by nearly 200%, while gold rebounded by 41% in just 5 months.
If the oversold level of gold stocks deepens further, and the price of gold falls below $2000, the subsequent rebound momentum will be more intense. During the process of gold prices rising from $1900 to $2400-2500, GDXJ may experience a dip followed by a rebound, with the rebound magnitude reaching 200%.