
Toronto, Ontario, July 21, 2020: Golden Tag Resources Ltd. (“Golden Tag” or the “Company“) (TSX.V: GOG) is pleased provide an update on the Company’s strategic opportunities and plans for growth. As silver prices continue to rebound, the Company’s 100% owned San Diego Project is well positioned as one of the largest undeveloped silver projects in Mexico, with significant potential for resource expansion.
Key Highlights:
Greg McKenzie, President and CEO commented, “Since taking over leadership of the Company in May 2020 we are pleased to see the share price begin to strengthen, however, we are excited about the tremendous organic and strategic growth opportunities and believe that with the ongoing support of our strong shareholder base Golden Tag is well positioned to capitalize on the continued rebound in silver prices.”
Meaningful Organic Growth at the San Diego Project
The 100% owned San Diego project, located in the prolific Velardeña Mining district within Durango, Mexico, is among the largest undeveloped silver assets in Mexico. This district, dominated by Peñoles, S.A.B. de C.V., has hosted silver and base metal mining operations for over 100 years. In 2013, the Company published a 43-101 resource prepared by SGS Canada, as outlined in Table 1 below on the San Diego Project. The resource was based on 33,000 metres of drilling and included mineralization from 23 different zones with strong lateral and vertical continuity. The last phase of drilling on the property was completed in 2012.
Table 1: Summary of Estimated Mineral Resources- San Diego Project (SGS 2013)
| SAN DIEGO RESOURCE ESTIMATE (1) | CoG (2) | Tonnes | Au | Ag | Pb | Zn | Ag.EQ (3) | Ag Oz |
| (g/t) | (Mt) | (g/t) | (g/t) | (%) | (%) | (g/t) | (M oz) | |
| INDICATED RESOURCES | ||||||||
| Oxide Veins [6] | 133 | 0.31 | 0.43 | 211 | NA (4) | NA (4) | 234 | 2.11 |
| Sulfide Veins [14] | 52-125 | 1.38 | 0.20 | 123 | 1.23 | 1.85 | 197 | 5.43 |
| Fernandez Zone [2] | 52 | 14.8 | 0.06 | 51 | 0.65 | 1.17 | 94 | 24.1 |
| TOTAL (5) | 16.5 | 31.6 | ||||||
| INFERRED RESOURCES | ||||||||
| Oxide Veins [8] | 133 | 0.29 | 0.43 | 238 | NA (4) | NA (4) | 261 | 2.2 |
| Sulfide Veins [19] | 52-125 | 13.1 | 0.11 | 93 | 1.41 | 1.83 | 171 | 39.2 |
| Fernandez Zone [2] | 52 | 28.7 | 0.05 | 46 | 0.7 | 1.08 | 88 | 42.4 |
| TOTAL (5) | 42.1 | 83.8 |
Notes: (1) Please refer to Table 1, page 3, SGS Canada “NI 43-101 Technical Report: Updated Mineral Resource Estimate San Diego Project” effective date April 12, 2013 available on www.sedar.com or the Golden Tag Web site www.goldentag.ca for further information. (2) CoG: Cut-Off Grade Ag.EQ (g/t); please refer to Table 31 on page 104 of the report for further information. (3) Ag.EQ: Silver Equivalent based on commodity prices of US$1455/oz Au, US$28.10/oz Ag, US$1.00/lb Pb, US$0.96/lb Zn applying estimated mill recoveries & smelter deductions & payables of 64.9% Ag, 76.4% Pb & 57.5% Zn for sulfide and 60.5% Ag & 62.5% Au for oxide resources. Zn and Pb are excluded from Ag.EQ for oxide resources and Cu and Au are excluded from Ag.EQ for sulfide resources. Please refer to Table 30 & Pages 103-104 of the report for more information. (4) Pb and Zn are excluded from oxide vein resources due to lack of metallurgical tests illustrating their potential recoveries. (5) Totals may not add up precisely due to rounding. (6) (Mt): million tonnes; (M oz): million ounces.
Cautionary Statement: Mineral Resources that are not Mineral Reserves do not have demonstrated economic viability. The resource estimate for the 21 veins and mineralized body were defined by a drill pattern and applying reasonable geological shapes to limit the lateral extent of the veins and mineralized body. Combinations of cross sectional and plan level views were used in order to develop an understanding of the structural relationship and cut off grades were applied. The indicated and inferred categories were partially based on historic structures that consistently exhibit lateral continuity and constant thickness, many of which can be traced along surface for hundreds of metres. There are no known factors such as environmental, permitting, legal, title, taxation, socio economic, marketing, political or other relevant factors which could materially affect the resources.
The San Diego property was originally known for narrow, high grade Ag veins in surface outcrop and shallow historic underground mine workings developed to mine oxidized veins. Initial exploration drilling confirmed the veins extended beneath the oxide zones as several laterally extensive, high-grade Ag-Pb-Zn sulfide veins to depths in excess of 400 metres. Drill campaigns in 2011-2012 demonstrated that below 500 metres, vein zones often widen, in some cases to more than 20 metres. This drilling campaign also identified broader mineralized zones, associated with intrusive bodies and hornfels, where massive sulfide, stockwork, and skarn mineralization and replacement sulfides in limestones occur in the southern part of the property (Figure 1).
In the 2013 resource report, SGS recognized the prospective nature of the property and concluded that existing known mineralized zones, extended laterally and along their dip, could potentially provide an additional 20-50 million tonnes grading from 100 to 150 g/t Aq.Eq. It should be noted that the SGS stated range of potential tonnage and grades are conceptual in nature and insufficient exploration work has been performed to define a mineral resource in these areas, and it is uncertain if further exploration will result in the target being delineated as a mineral resource. However, the potential to expand the resource tonnage is a positive organic growth opportunity for the Company.
The Company’s new management team have reviewed the historical work performed on the project, including SGS’s recommendations, and would like to highlight four key drill ready targets where the existing resources could potentially be expanded through additional drill programs:
Notes: (1) drill intercepts taken from Tables 12 & 15, pages 58-60 & 68-69 of the April 12, 2013 SGS 43-101 report; drill intercepts do not necessarily represent true widths. (2) Company news release dated August 27, 2008.
The Company is fully permitted to resume drilling at the San Diego Project and is in the process of designing a drill program, to be implemented as the silver price continues to recover.
Corporate Development Opportunities
The Company has commenced evaluating strategic opportunities to add shareholder value through merger & acquisitions or by acquiring projects directly. The focus will be in the America’s having a primary focus on silver.
About Golden Tag Resources
Golden Tag Resources Ltd. is a junior exploration company exploring for high-grade silver deposits. The Company holds a 100% interest, subject to a 2% NSR, in the San Diego property in Durango State, Mexico. The San Diego property is located within the prolific Velardeña Mining District, the site of several mines having produced silver, zinc, lead, and gold over the past century. For more information regarding the San Diego property please visit our website at www.goldentag.ca. Golden Tag has no debt and cash balances of approximately $2.1 million.
For additional information, please contact:
Greg McKenzie, President & CEO
Ph: 416-504-2024
Email: [email protected]
www.goldentag.ca
Qualified Person
The scientific and technical information in this document has been reviewed and approved by Bruce Robbins, P.Geo., a Qualified Person as defined by National Instrument 43-101.
Cautionary Statement:
Neither the TSX Venture Exchange nor its Regulation Services Provider (as that term is defined in the policies of the TSX Venture Exchange) accepts responsibility for the adequacy or accuracy of this news release.
This News Release includes certain “forward-looking statements” which are not comprised of historical facts. Forward-looking statements include estimates and statements that describe the Company’s future plans, objectives or goals, including words to the effect that the Company, or management, expects a stated condition or result to occur. Forward looking information in this news release includes, but is not limited to, anticipated growth of the resource through exploration drilling, anticipated project acquisitions or merger/acquisition activities, the ability to find and acquire new resource mineral projects, and the ability to fund future drill programs.
Disclaimer: The Company featured in this article is a client of NAI Interactive Ltd. This material is provided for information purposes only and does not bind NAI Interactive Ltd. in any way. It is not intended as a recommendation or an offer or solicitation for the purchase or sale of any security or financial instrument, or to enter into a transaction involving any financial instrument or trading strategy.
Figure 1: Plan View of San Diego Project Outlining Four Key Exploration Zones
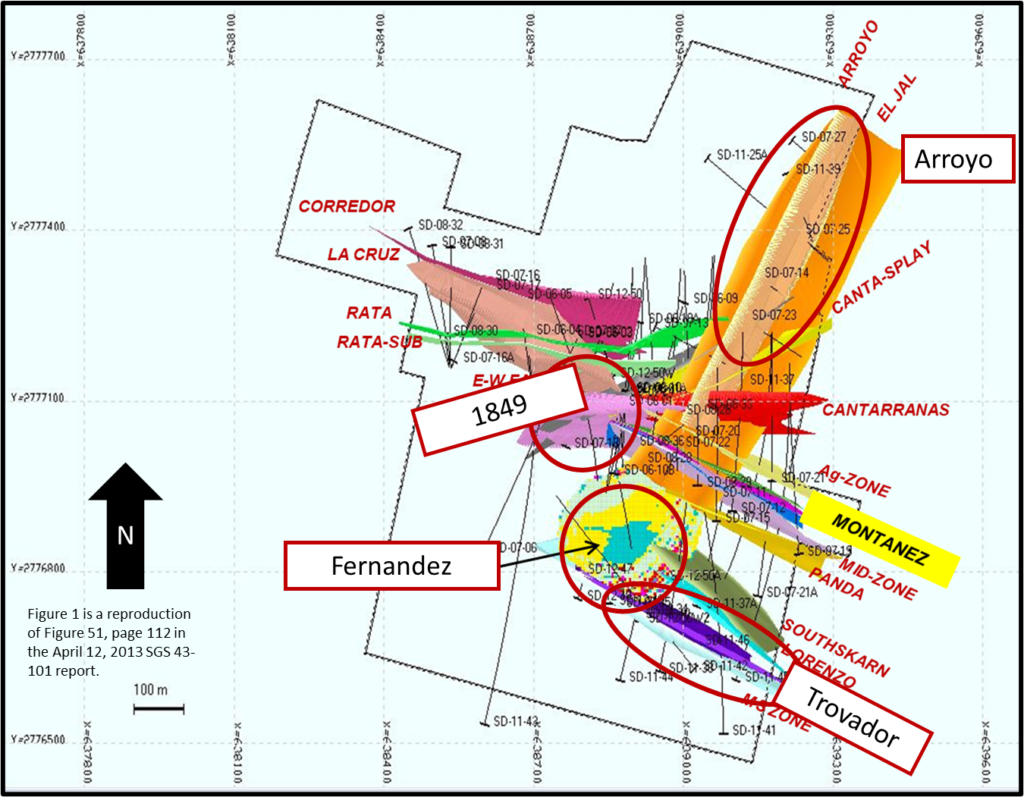
Figure 2: Cross-section 1849 Target & Fernandez Zone along hole SD-12-49 (view to ENE)
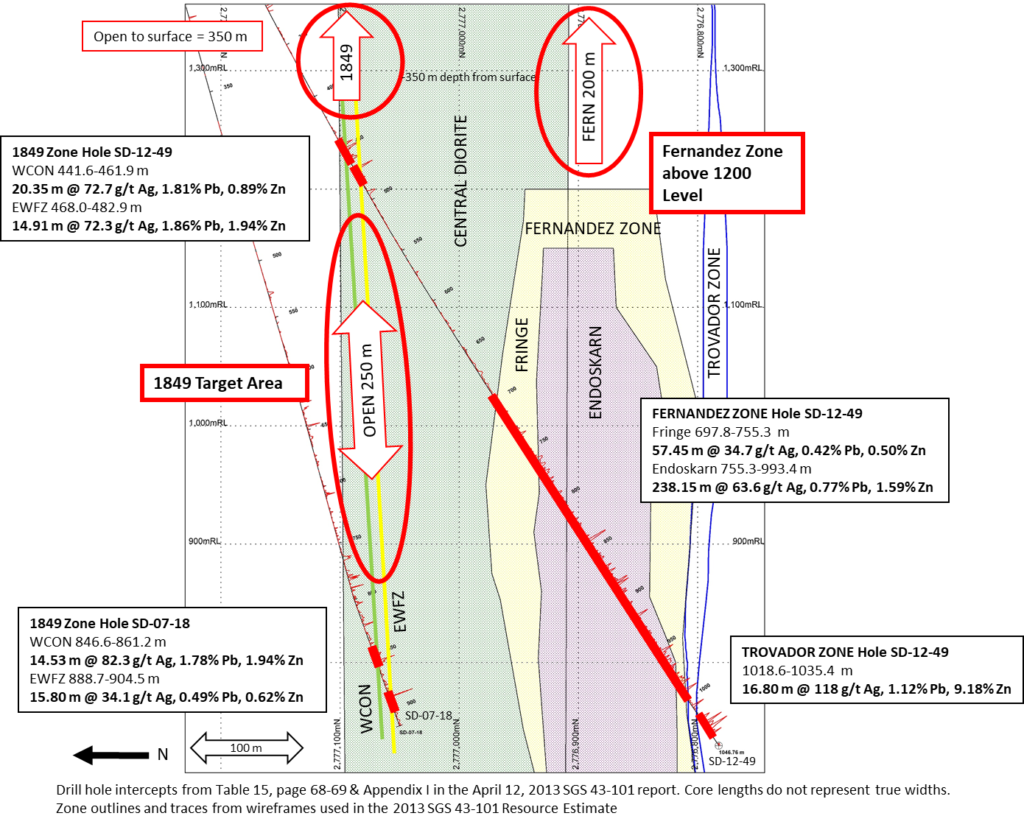
Figure 3: Plan View of Fernandez Zone at 875 m Level – 2012 Drilling Results
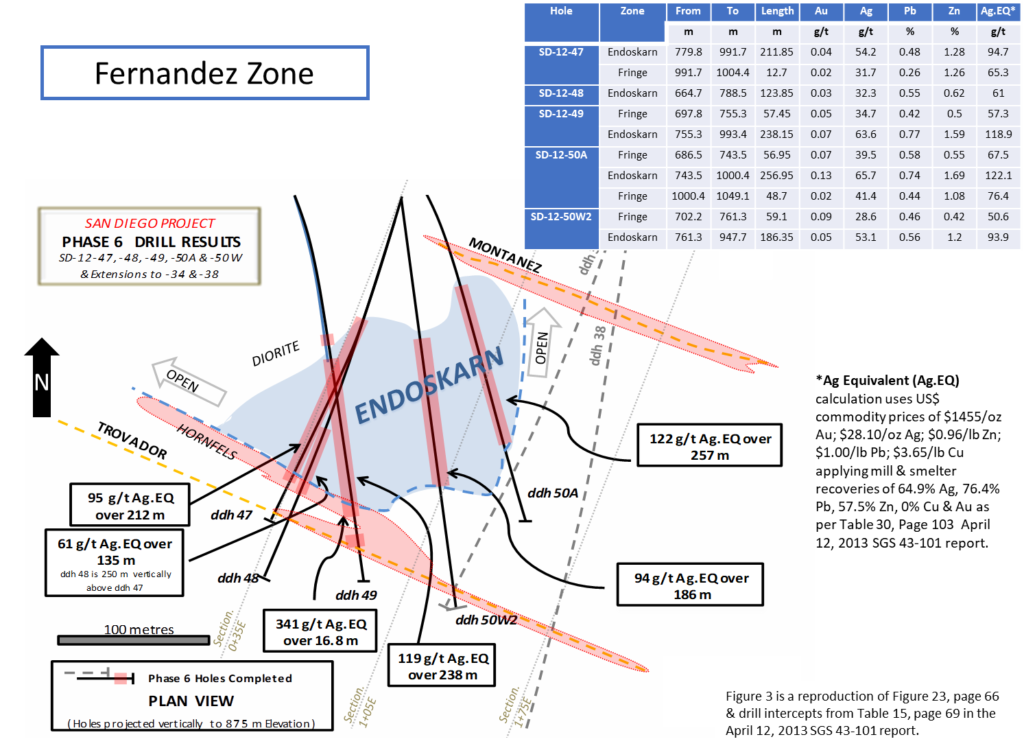
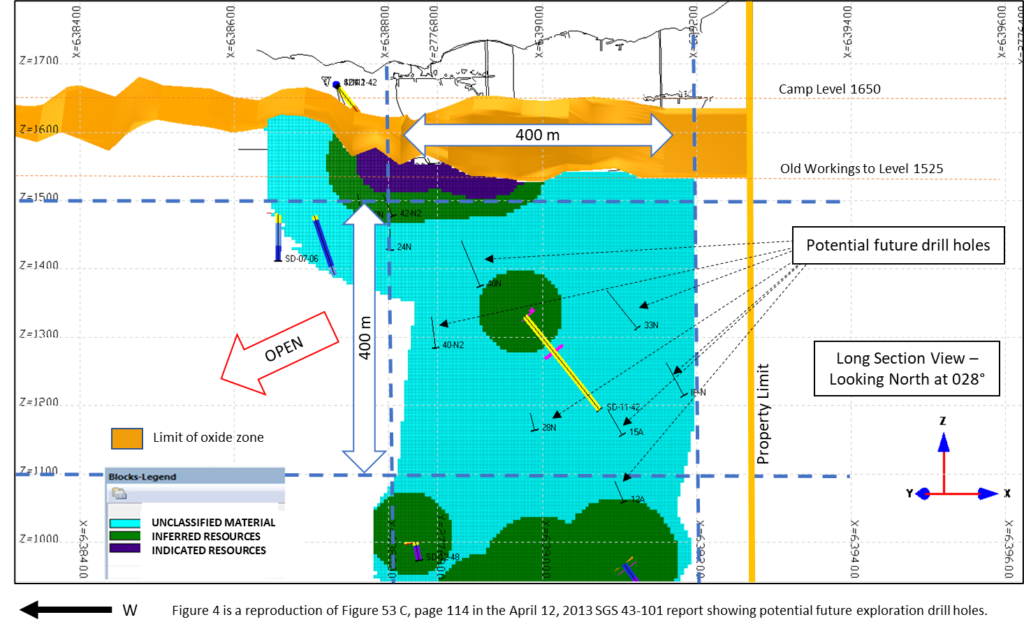
Figure 4: Longitudinal Section of Trova