
US stock markets just enjoyed their best week of the year on speculation that the Federal Reserve would once again ride to the rescue of equities and inflate asset prices by cutting rates.
The S&P 500 index is sporting double digit percentage gains so far this year. Meanwhile, the S&P GSCI All Commodities index is down 14% over the past year.
Apart from all things gold, Incrementum’s 13th annual In Gold We Trust report also features broader takes on the environment for raw materials and argues that in a historical context commodities remain undervalued compared to stock markets in the extreme.
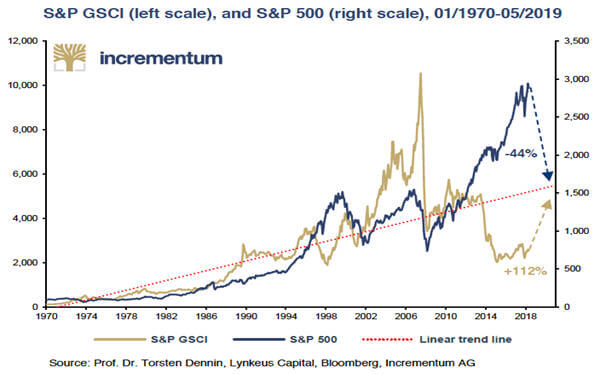
Plotting the S&P GSCI and the S&P 500 all the way back to 1970 shows the indices long-term upward trend line and the current disconnect between commodities and equities:
To return to this trend line – which happens on average every 6 to 8 years – the S&P would have to fall by 44% and the GSCI to rise by 112%.
This is a scenario that seems highly unlikely, if not impossible, at the moment. However, a glance at the following chart or at the history books puts this alleged impossibility into perspective.
Source: Mining.com