
The continuous surge in gold and silver prices recently has garnered significant market attention, leading many to question whether the current precious metals market is merely speculative, with prices being overvalued.
Addressing this issue, private investor Don Hansen, who specializes in resource sector investments, posits that the upward potential in gold and silver prices is not solely speculative. To support his argument, he analyzed the historical relationship between gold prices since 1970 and the US money supply.
Hansen explains that the historical relationship between gold and the money supply not only supports the current rise in gold and silver prices but also indicates that, notably, in bull markets for gold, the majority of gains tend to occur in the final 2 to 3 years. As we are currently in the early stages of this cycle, significant profit opportunities remain for gold and silver investors.
Discussing the money supply involves the concept of M2. The money supply has three definitions: M0, M1, and M2, with M2 being referred to as broad money supply, including cash, check deposits, savings deposits, and money market funds.
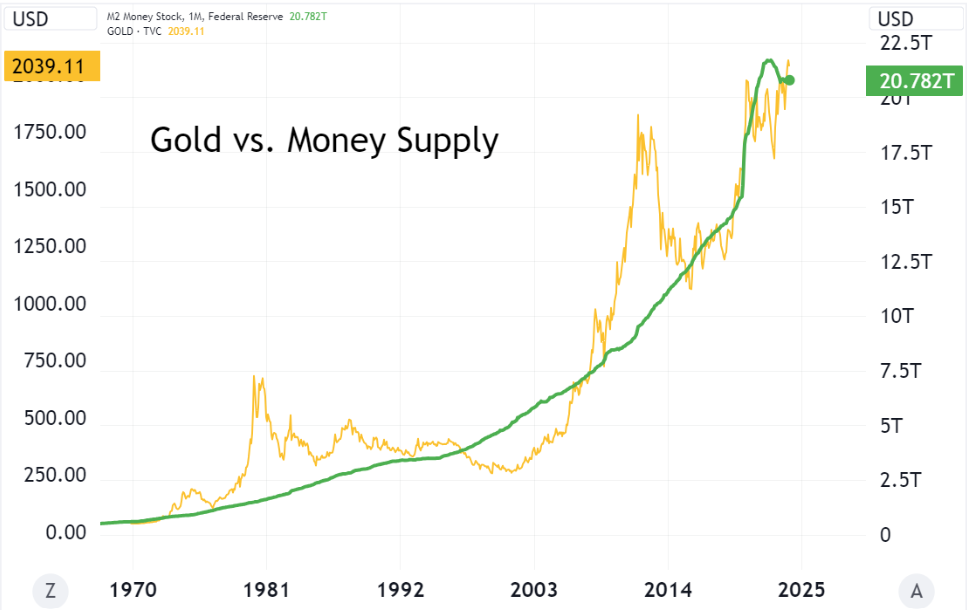
As illustrated above, since the Federal Reserve began tracking this indicator in 1959, the US M2 money supply has experienced exponential growth, resulting in currency devaluation and sustained increases in goods and service prices. Throughout this process, the gold price has followed the growth in the money supply, leading to an exponential return on gold over the past 50 years. Moreover, the parabolic growth in the money supply is far from being over.
This relationship between gold and the money supply holds globally as well. Data from the World Gold Council (WGC) shows that over the past 50 years, gold has consistently and reliably followed the growth in global money supply, outperforming even US Treasury bills.
By dividing the gold price by the M2 money supply, we derive the gold/M2 ratio. This ratio serves to gauge whether gold is overvalued or undervalued relative to the M2 money supply. A low ratio signifies gold being undervalued, while a high ratio indicates overvaluation.
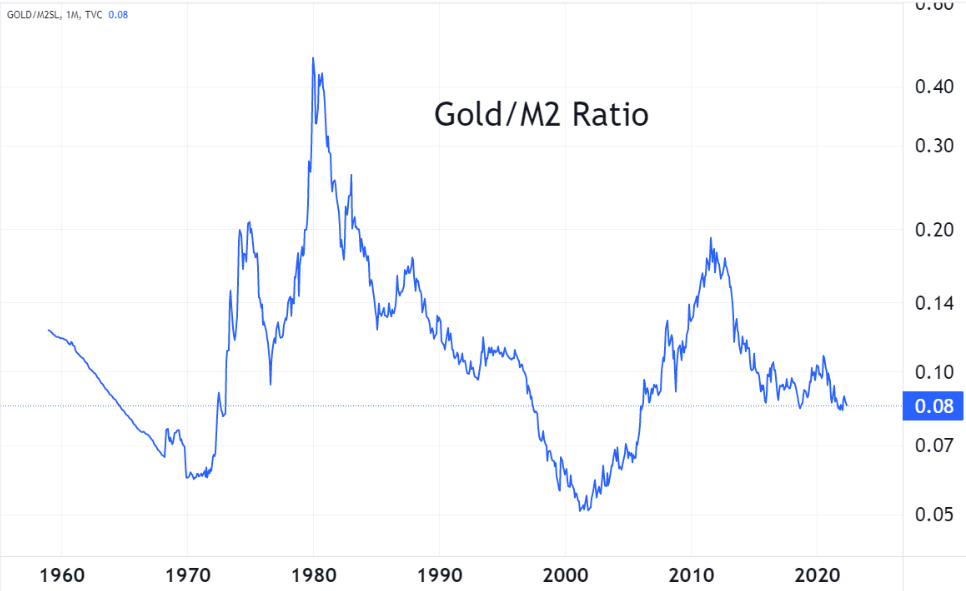
As shown, bull markets in gold typically correspond to significant increases in this ratio, for example, during the periods of 1971-1980 and 2000-2011. However, in the current bull market (starting in 2016), the ratio has traded sideways as the price of gold has increased in tandem with the M2 money supply.
Nonetheless, this may suggest that gold still possesses substantial upward potential during this bull market. Gold bull markets typically significantly outperform the growth of the money supply, a trend not yet observed currently. Even a return to historical mean could unlock vast potential for gold price increases.