Southern Silver Exploration Corp. (TSXV: SSV, SSEV: SSVCL, OTCQX: SSVFF)
Southern Silver, a low-risk junior development company with substantial upside potential that is emerging as one of the premier Ag-Pb-Zn companies in Mexico
As of the close on April 13, spot silver stood at $74.212 per ounce, up 2.26% on the day. Silver prices briefly surged during the early Asian session but then fell into a very narrow trading range, reflecting market hesitation in choosing a direction. Looking back at recent trends, the silver market is showing clear long-short divergence.
On one hand, fund managers are optimistic that silver is building a “structural new base” around $70. On the other hand, technical charts are flashing a warning signal in the form of a “bearish engulfing” pattern — the last time this signal appeared, precious metals experienced six consecutive months of decline.
Nate Miller, Vice President of Product Development at Amplify ETFs, pointed out that silver has left the $20–30 era behind. “$60 or $70 silver will become the new normal, and consolidation around $70 is a positive signal of a structural shift.” Miller said that $70 silver makes projects that were unprofitable at $25 viable. Miners are using higher prices to improve balance sheets rather than taking on excessive risk.
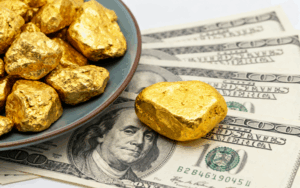
Meanwhile, on the macro front, although data for March retreated, first-quarter silver bar and coin sales at the Perth Mint exceeded 4.6 million ounces, and at the U.S. Mint exceeded 8.1 million ounces — both far stronger than the same period in 2025, indicating that investors actively increased positions during the sharp sell-off in early February.
Miller emphasized that whether silver can return to $100–120 depends heavily on inflation. If inflation remains sticky, demand for silver as a store of value will be activated; if inflation proves temporary, upside will be limited to the $70–80 range.
In contrast to the fundamental optimism, Heraeus analysts pointed out that a bearish engulfing pattern formed on the monthly chart in March — meaning that March opened higher than February’s close but ultimately closed lower than early February levels. This suggests that before the bull market can resume, there may be several months of consolidation and sideways-to-downward price action. The last time gold formed a similar pattern was in April 2022, after which gold prices fell for six consecutive months from $2,000 to $1,600.
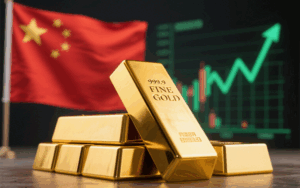
On the central bank front, global central banks were net buyers of 27 tonnes of gold in February (up from 5 tonnes in January). The National Bank of Poland added 20.2 tonnes, while Uzbekistan and Kazakhstan added 7.8 tonnes and 7.7 tonnes, respectively. In 2025, global central banks accumulated a total of 863 tonnes of gold, reinforcing the narrative of precious metals as reserve assets.
Looking ahead, in the short term, silver is most likely to continue trading in the $70–80 range. The main reasons are that industrial demand provides a solid floor, but there is a lack of catalysts for a breakout, and the technical pattern needs time to digest. In an optimistic scenario, if silver can break above $80, it would have the opportunity to test $90–100, triggered by unexpected inflation upside or escalating geopolitical risks. Conversely, if it breaks below $70, a test of $60–65 cannot be ruled out, triggered by a significant global economic slowdown or a sharp strengthening of the U.S. dollar.
In summary, silver is building a “higher and more stable” new base around $70 — a signal of structural change and a historic breakout from the price range of the past two decades. However, the bearish engulfing pattern warning from technical analysis suggests that the resumption of the bull market may take several months.