
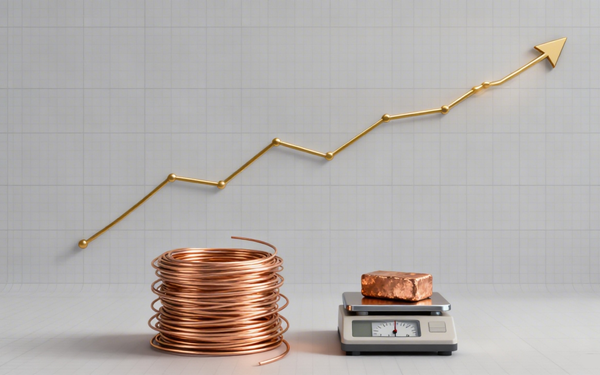
Copper futures on Comex set a fresh record Wednesday, with the September contract touching $6.7140 a pound ($14,802 a tonne) in New York, clearing the previous all-time high of $6.7045 set on August 5, before easing back to $6.6335 and finishing little changed on the day. The December contract reached $6.8070, while copper for delivery in September 2027 changed hands at $7.0280 a pound.
In London, cash copper on the LME settled at $14,424.50 a tonne on Tuesday — a premium of $207.50 over the three-month contract at $14,217.00 — the widest backwardation of 2026. That spread stood at $138 the previous day and just $34 at the end of July. LME warehouse inventories have fallen to 214,550 tonnes, a drop of more than 35,000 tonnes, or 14%, since the end of July. Comex copper is trading around $14,625 a tonne, roughly $400 above the London three-month price. Copper has gained about 18% in 2026 and 47% over the past 12 months.
The rally has opened significant valuation gaps across copper miners. The table below compares market capitalization, forward P/E, EV/EBITDA, free cash flow yield, debt-to-equity, fair value upside, and one-year return for major copper equities.
| Stock | Mkt Cap | P/E (Fwd) | EV/EBITDA | FCF Yield | D/E | FV Upside | 1Y Return |
| Teck Resources (TECK) | $32.8B | 14.6x | 7.5x | 4.2% | 35.5% | +6.6% | +108.6% |
| Glencore (GLEN) | $90.2B | 12.5x | 9.0x | -1.5% | 108.5% | +13.4% | +98.7% |
| First Quantum (FM) | $26.4B | N/M | 20.4x | 1.9% | 67.7% | +10.8% | +91.5% |
| Hudbay Minerals (HBM) | $12.4B | 19.3x | 11.1x | 2.3% | 21.8% | -11.7% | +196.0% |
| Southern Copper (SCCO) | $167.0B | 25.9x | 17.0x | 3.1% | 68.3% | -20.7% | +121.4% |
| Freeport-McMoRan (FCX) | $101.3B | 23.7x | 12.5x | 1.7% | 51.5% | -14.7% | +71.9% |
| Antofagasta (ANTO) | $53.5B | 30.0x | 11.9x | -1.1% | 73.9% | -19.8% | +100.1% |
All figures as of Aug 11, 2026. FV Upside = fair value model vs. current price. Screener snapshots may lag live prices.
Teck Resources stands out as the most balanced opportunity among major copper producers. It trades at a forward P/E of 14.6x and EV/EBITDA of just 7.5x, the cheapest valuation across every metric in the peer group. Its balance sheet is the cleanest, with a debt-to-equity ratio of only 35.5%, and it generates a 4.2% free cash flow yield — the highest among profitable copper miners. The fair value model still points to 6.6% upside, suggesting the market has not fully priced in copper’s trajectory. Teck’s recent pivot toward copper following the sale of its steelmaking coal business has increased its exposure to the red metal.
Glencore trades at the lowest multiples in the group, with a forward P/E of 12.5x and EV/EBITDA of 9.0x. Its fair value model shows 13.4% upside, the most of any name in the table. The trade-off is a hefty 108.5% debt-to-equity ratio and negative free cash flow. As a diversified miner-trader, Glencore’s copper purity is diluted, but its scale and cheap valuation make it a leveraged bet on broad commodity strength.
Southern Copper is the sector’s leading franchise, with a 50.1% return on equity that is peerless in mining and the world’s largest copper reserves. But the market already prices that quality. At 29.5x trailing earnings and with a fair value model showing 20.7% overvaluation, Southern Copper is a long-term compounder rather than a value entry point. Freeport-McMoRan, the largest U.S.-listed copper miner, trades at 34.5x trailing earnings with 14.7% fair value downside. It is an excellent operator, but the copper rally appears fully reflected in the share price.
For investors seeking diversified copper exposure without single-stock risk, the Global X Copper Miners ETF (COPX) holds 44 copper miners, with top positions in Hudbay Minerals (5.7%), Teck Resources (5.3%), BHP (5.1%), First Quantum (5.1%), and Southern Copper (5.0%). COPX trades at a P/E of 14.2x with a 2.2% dividend yield, offering a cheaper entry than most individual names — though its beta of 2.06 means it amplifies copper’s moves in both directions.
As copper sets new highs, investors need to separate valuation from quality. Cheapness alone is not the only criterion: high return on equity and reserve strength often command a premium. The valuation table and fair value models offer a useful reference, but real-time screens may lag market prices.