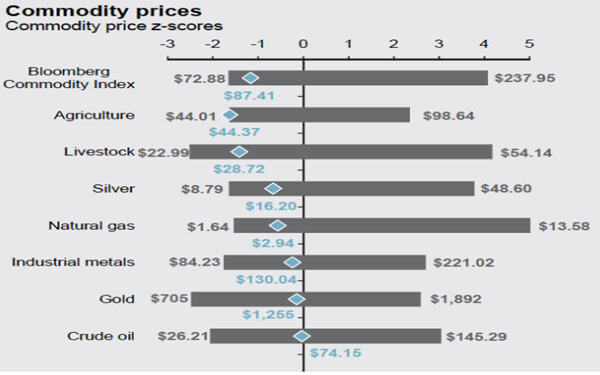
CHART: Copper, nickel, zinc prices – plenty upside just to revert to mean
Metals and minerals prices have come a long way since hitting multi-year lows late-2015, early 2016.
Copper is up by nearly half, recent weakness notwithstanding. Zinc’s nearly doubled since then and nickel bulls (suddenly aplenty) have achieved the same for devil’s copper, the only major metal in positive territory for 2018.
Gold has gained 20% from lows hit mid-December 2015; technically a bull market (just don’t jinx it for the bugs by calling it that). Silver’s been a disappointment but it’s certainly well above the $13.58 an ounce fix of 28 January 2016.
JP Morgan Asset Management in its third quarter 2018 Guide to the Markets updates updates the z-scores of commodities. A z-score is the number of standard deviations separating the current price (June 30 in the graph) from the mean price.
The underlying assumption is that over time prices will revert to the mean and a number below zero suggests the commodity is “underpriced”; for lack of a better word. Commodities are also prone to overshoot on the upside with the index stretching to four standard deviations at points during the past 10 years.
Even after two years of solid gains, the JP Morgan calculations suggest industrial metals have further to run or at the least appear far from frothy. Silver looks real cheap, but gold and oil crude may be fully priced already. Agriculture and livestock looks poised for a recovery (or not).
Source: Mining.com
Copper
Gold
Mining