MONTREAL–March 27, 2024–(BUSINESS WIRE)– Dynacor Group Inc. (TSX: DNG) (Dynacor or the Corporation) released its audited annual consolidated financial statements and the management’s discussion and analysis (MD&A) for the year ended December 31, 2023.
 (Graphic: Business Wire)
These documents have been filed electronically with SEDAR+ at www.sedarplus.com and will be available on the Corporation’s website www.dynacor.com.
(All figures in this press release are in Ms of US$ unless stated otherwise. All amounts per share are in US$. All variance % are calculated from rounded figures. Some additions might be incorrect due to rounding).
2023 OVERVIEW AND HIGHLIGHTS
OVERVIEW
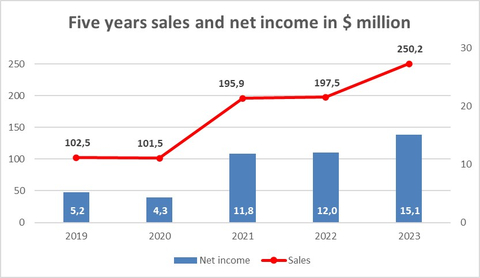
Dynacor completed 2023 with both production and financial historical high performances generating its thirteenth (13th) consecutive year of profit. The Corporation achieved a production record of 130,001 AuEq ounces powering total sales to $250.2 million (CA$337.6 million), an increase of +26.7% compared to 2022 and a net income of $15.1 million (US$0.39 or CA$0.53 per share), an increase of +25.8% compared to 2022.
2023 was the first full year of operation at a processing capacity of 500 tonnes per day. Thanks to its high level of ore inventory at the opening of the year and the high volume of ore supplied and purchased, the mill has been able to operate at full capacity throughout the year averaging a new daily record processing rate of 468 tpd.
HIGHLIGHTS
Operational
Financial
Return to Shareholders
(1) Cash gross operating margin per AuEq ounce is in US$ and is calculated by subtracting the average cash cost of sale per equivalent ounces of Au from the average selling price per equivalent ounces of Au and is a non-IFRS financial performance measure with no standard definition under IFRS Accounting Standards. It is therefore possible that this measure could not be comparable with a similar measure of another company.
(2) EBITDA: “Earnings before interest, taxes and depreciation” is a non-IFRS financial performance measure with no standard definition under IFRS Accounting Standards. It is therefore possible that this measure could not be comparable with a similar measure of another corporation. The Corporation uses this non-IFRS measure as an indicator of the cash generated by the operations and allows investor to compare the profitability of the Corporation with others by canceling effects of different assets basis, effects due to different tax structures as well as the effects of different capital structures.
(3) Cash-flow per share is a non-IFRS financial performance measure with no standard definition under IFRS Accounting Standards. It is therefore possible that this measure could not be comparable with a similar measure of another corporation. The Corporation uses this non-IFRS measure which can also be helpful to investors as it provides a result which can be compared with the Corporation market share price.
RESULTS FROM OPERATIONS
Consolidated Statement of net income and comprehensive income
|
|
For the years ended December 31, |
|
|
(in $’000) |
2023 |
2022 |
|
|
|
|
|
Sales |
250,189 |
197,545 |
|
Cost of sales |
(219,989) |
(173,120) |
|
Gross operating margin |
30,200 |
24,425 |
|
General and administrative expenses |
(7,096) |
(5,970) |
|
Other projects expenses |
(1,005) |
(318) |
|
Operating income |
22,099 |
18,137 |
|
Financial income net of expenses |
750 |
85 |
|
Foreign exchange gain (loss) |
98 |
(105) |
|
Income before income taxes |
22,947 |
18,117 |
|
Current income tax expense |
(8,311) |
(6,548) |
|
Deferred income tax recovery |
432 |
445 |
|
Net income and comprehensive income |
15,068 |
12,014 |
|
|
|
|
|
Earnings per share |
|
|
|
Basic |
$0.39 |
$0.31 |
|
Diluted |
$0.39 |
$0.30 |
Total sales amounted to $250.2 million compared to $197.5 million in 2022. The $52.7 million increase is explained by quantities sold and higher average selling prices contributing to respectively a +$35.1 million and a +$17.6 million increase.
The 2023 gross operating margin amounted to $30.2 million (12.1% of sales) compared to $24.4 million (12.4% of sales) in 2022. The 2023 gross operating margin in dollar was positively impacted by higher sales and by the overall positive trend in gold market prices compared to 2022.
General and administrative expenses amounted to $7.1 million in 2023 compared $6.0 million in 2022. The increase is mainly explained by increases in salaries and share-based expenses.
Other projects represent the expenses incurred by the Corporation to duplicate its unique business model in the same or other jurisdictions.
A $7.9 million income tax expense was also recorded in 2023. This expense includes $0.5 million of withholding tax paid on dividends received from the subsidiary and a -$0.5 million (non-cash) deferred income tax recovery. The deferred tax expense or recovery is mainly explained by the variance throughout the period of the Peruvian Sol against the US$ which affect long term assets local tax basis. Future fluctuations will affect positively or negatively the deferred tax at the end of each period.
Reconciliation of non-IFRS measures
|
(in $’000) |
For the years ended December 31, |
|
|
|
2023 |
2022 |
|
Reconciliation of net income and comprehensive income to EBITDA |
|
|
|
Net income and comprehensive income |
15,068 |
12,014 |
|
Income taxes expense (current and deferred) |
7,879 |
6,103 |
|
Financial income net of expenses |
(757) |
(85) |
|
Depreciation |
3,349 |
3,205 |
|
EBITDA |
25,539 |
21,237 |
CONSOLIDATED CASH FLOW FROM OPERATING, INVESTING AND FINANCING ACTIVITIES AND WORKING CAPITAL AND LIQUIDITY
Operating activities
For the year ended December 31, 2023, the cash flow from operations, before changes in working capital items, amounted to $18.6 million compared to $14.9 million for the year ended December 31, 2022. Net cash from operating activities amounted to $9.6 million compared to $6.2 million for the year ended December 31, 2022. Changes in working capital items amounted to (-$9.0 million) compared to (-$8.7 million) for the year ended December 31, 2022.
Investing activities
In 2023, Dynacor invested $6.5 million in capital expenditure including $3.0 million for the purchase of an office in Lima. Other investments comprised of additions to the plant and purchases of rolling stocks. All investments have been financed with internally generated cash-flows.
Financing activities
In 2023, monthly dividends of CA$0.01 representing an annual total of CA$0.12 per share were disbursed for a total consideration of $3.4 million (CA$4.6 million). In 2022, monthly dividends of CA$0.0083 representing a total of CA$0.10 per share were disbursed for a total consideration of $3.0 million (CA$3.9 million).
In 2023, 1,127,397 common shares were repurchased under the Corporation normal course issuer bid share buyback program for a total cash consideration of $2.9 million (CA$ 3.9 million) (819,416 shares for a total cash consideration of $1.9 million (CA$ 2.4 million) in 2022).
Subsequent to December 31, 2023, the Corporation has repurchased 926,800 common shares for a total cash consideration of $2,751,499 (CA$ 3,705,613), an average repurchase cost of $2.97 (CA$4.00) per share.
Working capital and liquidity
As at December 31, 2023, the Corporation’s working capital amounted to $50.8 million, including $22.5 million in cash ($43.7 million, including $25.6 million in cash at December 31, 2022).
CONSOLIDATED STATEMENT OF FINANCIAL POSITION
As at December 31, 2023, total assets amounted to $111.8 million ($96.9 million as at December 31, 2022). Major variances since last year-end come from the significant increase in inventories and the variance in the trade and other payables.
|
(in $’000) |
|
As at December 31, |
As at December 31, |
|
|
|
2023 |
2022 |
|
Cash |
|
22,481 |
25,595 |
|
Accounts receivable |
|
13,328 |
12,298 |
|
Inventories |
|
31,925 |
16,447 |
|
Prepaid |
|
277 |
223 |
|
Current tax assets |
|
– |
371 |
|
Property, plant and equipment |
|
24,590 |
21,392 |
|
Right-of-use assets |
|
613 |
701 |
|
Exploration and evaluation assets |
|
18,566 |
18,543 |
|
Other non-current assets |
|
– |
1,332 |
|
Total assets |
|
111,780 |
96,902 |
|
|
|
|
|
|
Trade and other payables |
|
15,357 |
11,168 |
|
Asset retirement obligations |
|
3,724 |
3,642 |
|
Current tax liabilities |
|
1,799 |
– |
|
Deferred tax liabilities |
|
677 |
1,110 |
|
Lease liabilities |
|
636 |
701 |
|
Shareholders’ equity |
|
89,587 |
80,281 |
|
Total liabilities and equity |
|
111,780 |
96,902 |
OUTLOOK 2024
Ore processing
For 2024, the Corporation forecasted sales (1) ranging between $265-285 million representing a growth of 6-14% over 2023 sales. Net income is forecasted ranging between $12-15 million ($0.33-0.41 per share) (CA$0.45-0.56 per share) and include expenses of $2.7 million to advance other projects in other jurisdictions.
Dynacor Group plans to invest up to US$13 million in capital expenditures in 2024. This investment will be used at our Veta Dorada plant for new equipment to improve efficiency, increase tailing pond capacity, vehicles to support the security of our purchasers working in remote areas and will include, upon favourable conditions, up to $4 million to pursue the due diligence process and development of new projects in other jurisdictions.
(1) Using a market gold price ranging between $2,000 and $2,050 per ounce
ABOUT DYNACOR
Dynacor is a dividend-paying industrial gold ore processor headquartered in Montreal, Canada. The corporation is engaged in gold production through the processing of ore purchased from the ASM (artisanal and small-scale mining) industry. At present, Dynacor operates in Peru, where its management and processing teams have decades of experience working with ASM miners. It also owns a gold exploration property (Tumipampa) in the Apurimac department.
The corporation intends to expand its processing operations in other jurisdictions as well.
Dynacor produces environmental and socially responsible gold through its PX IMPACT® gold program. A growing number of supportive firms from the fine luxury jewelry, watchmakers and investment sectors pay a small premium to our customer and strategic partner for this PX IMPACT® gold. The premium provides direct investment to develop health and education projects for our artisanal and small-scale miner’s communities.
Dynacor is listed on the Toronto Stock Exchange (DNG).
FORWARD-LOOKING INFORMATION
Certain statements in the preceding may constitute forward-looking statements, which involve known and unknown risks, uncertainties and other factors that may cause the actual results, performance, or achievements of Dynacor, or industry results, to be materially different from any future result, performance or achievement expressed or implied by such forward-looking statements. These statements reflect management’s current expectations regarding future events and operating performance as of the date of this news release.
Shares Outstanding: 36,523,356
Website: http://www.dynacor.com
Twitter: http://twitter.com/DynacorGold
For more information, please contact:
Director, Shareholder Relations
Dale Nejmeldeen
Dynacor Group Inc.
T: 514-393-9000 #230
E: [email protected]